|
We collected, categorized, and profiled separately all the works and test results of students; this data and statistics will help new students to make right decision choosing classes. We are honored to serve all students who have been with us and be proud of all of them.
BEW students cumulative school grades percentile (2007~2010 classes)
|
|||||||||||||||||||||||||||||||||||||||||||||||||||||||||||||||||||||||||||||||||||||||||||||||||||||||||||||||||||||||||||||||||||||||||||||||||||||||||||||||||||||||||||
| Top 10% | 78.7% |
| Top 10 ~ 20% | 9.5% |
| Top 20 ~ 30% | 7.2% |
Highest: 99% Average: 85.3% Lowest: 75%
| Verbal | Math | Reading | |
| 95%~99% | 57.5% | 75.3% | 25.5% |
| 90%~94% | 23% | 15.1% | 27.9% |
| 85%~89% | 5.6% | 8.1% | 20% |
| 80%~84% | 6.7% | 1.5% | 10.5% |
| 75%~80% | 7% | - | 6.2% |
Highest: 115 Average: 98 Lowest: 79
| Reading | Listening | Speaking | Writing | |
| 25~30 | 35.8% | 65.5% | 46.1% | 35.7% |
| 20~24 | 23.9% | 22% | 30.5% | 37.8% |
| 15~19 | 11.5% | 10.2% | 15.7% | 25.5% |
| 10~14 | 16.3% | 2.3% | 6.4% | 1% |
Highest: 2320 Average: 1963 Lowest: 1580
| Critical Reading | Math | Writing | |
| 750-800 | 15.4% | 46.2% | 30.7% |
| 700-740 | 23% | 30.7% | - |
| 650-690 | 7.7% | 15.4% | 7.7% |
| 600-640 | 7.7% | 7.7% | 23% |
| 550-590 | 7.7% | - | 7.7% |
| Subjects | BEW 2010 2009 |
Phillips Andover | National | |
| Math 2C | 776 | 770 | 719 | 648 |
| Chemistry | 720 | 741 | 693 | 638 |
| Biology E | 733 | 750 | 681 | 598 |
| Physics | 765 | 713 | 708 | 655 |
| U.S. History | 740 | 720 | 682 | 599 |
| Literature | 665 | N/A | 659 | 580 |
| World History | N/A | 720 | N/A | N/A |
| Latin | N/A | 770 | 724 | 763 |
| Spanish | N/A | 730 | 691 | 646 |
The most subjects of SAT II that our students have taken so far were Math 2C and Chemistry. If students score 700 and up, it is ideal. And the most colleges require about two subjects of SAT II, we recommend and direct students to take at least three subjects of SAT II.
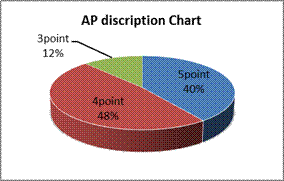
| Scores | 2009 | 2010 |
| 5 | 40% | 50% |
| 4 | 48% | 37% |
| 3 | 12% | 13% |
Test score of 3 and below does not help at all. Taking many AP exam doesn’t mean anything; rather having a good score in a few subjects is much better option. Students should have a clear goal and constant effort preparing exams in order to achieve good score.
| 2010 | 2011 | |
| National Scholastic Arts Contest | Gold (3), Silver (3), Honorable mention (4) | Gold (4), Silver (9), Honorable mention (10) |
| National Scholastic Writing Contest | Gold (2), Silver (4), Honorable mention (4) | Gold (11), Silver (4), Honorable mention (18) |
| AMC 10&12 / AIME | 4 | 3 |
| New England Math Contest | 5 | 3 |
| National Latin Exam | Summa Cum Laude (2) | Summa Cum Laude(3) Cum Laude(1) |
| National Spanish Exam | Gold (2) | Silver(1) |
| Intel Science Contest | Semi-Finalist (1) | |
| Siemens Science Contest | Semi-Finalist (1) | |
| The President’s Volunteer Service Awards | Gold (8), Silver (2) | Gold (13), Silver (5), Bronze(9) |
Almost all students attending Bostonedu applied for the AP exam in 2010. On average, each student took exams on 2.7 subjects. We have seen students take as many as ten subjects, or as few as none. The average AP exam score of those who did take AP tests was 4.2. Below illustrates the distribution of these exam scores. Students mostly took Calculus AB and BC, with Chemistry next, followed by Biology, Physics, and English.
 Students also took US History, English Literature, Microeconomics, Macroeconomics, World History, European History, Art History, Music Theory, Government and Politics, Psychology, Statistics, Latin, and Spanish.